Checked against the sources listed below; several are secondary.
Most of the numbers below come from Wikipedia summaries, the treaty text and the International Joint Commission. We could not reach several primary pages (Niagara Parks, NY State Parks, USGS, the New York Power Authority and Ontario Power Generation) when we checked on October 17, 2026. So each table gives a source note and a confidence level, and where tourist sites and reference sites disagree we show both. None of this changes how the boat ride works, but if you quote a figure, quote its basis too. For the rides themselves, start with the boat tours guide.
How high are the falls?
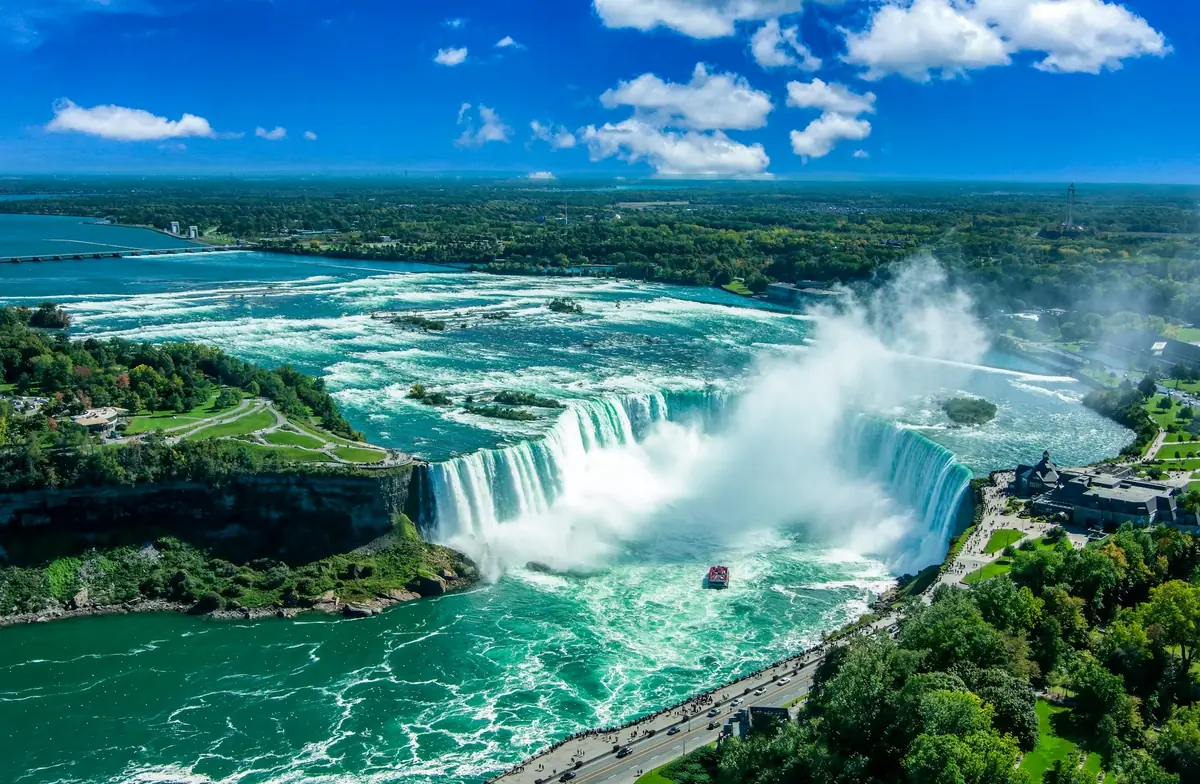
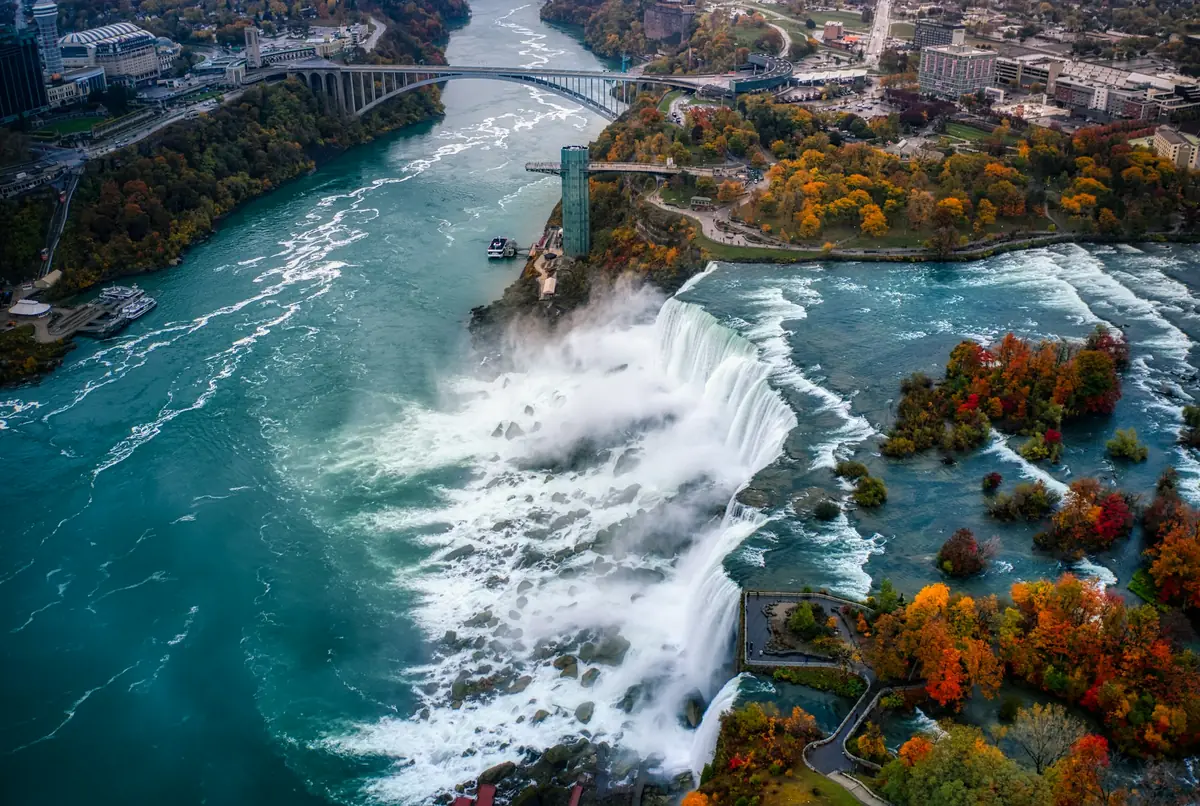
There are three falls: the Horseshoe Falls on the Canadian side, and the American and Bridal Veil Falls on the US side, with Goat Island between. The common claim that "the falls are 167 feet high" is a combined summary figure, not a fact about any one of them.
| Falls | Height | Measurement basis and caveats | Confidence |
|---|---|---|---|
| Horseshoe Falls | About 57 m (187 ft); the popular figure is 188 ft | Wikipedia. No Niagara Parks, NY State Parks or USGS page was reachable for this check. | Medium |
| American Falls | 21 to 30 m (69 to 98 ft) to the boulder pile; about 57 m (about 188 ft) to the river | The lower figure measures to the pile of fallen rock (talus) at the base. The higher figure measures to the river. | Medium |
| Bridal Veil Falls | Official height not verified | Non-official sites quote a crest of about 56 ft (17 m) and a drop of about 181 ft. We do not rely on them. | Low |
| All three combined | 51 m (167 ft) in Wikipedia's summary box | Not a measurement of any one falls. We show it only because it appears in widely copied listings. | Medium |
The American Falls has two heights because of a pile of fallen rock at its base. Measured to the top of the pile it is shorter, and measured to the river it is about as tall as the Horseshoe. When a page says "the American Falls is 69 to 98 feet", it is using the first basis. We cannot say which basis a given tourism page used unless it says so.
How wide are the falls?
Crest width is the most inconsistent number in popular writing, because the Horseshoe crest curves and the American crest is uneven.
| Falls | Crest width | Why sources differ |
|---|---|---|
| Horseshoe Falls | About 790 m (2,592 ft) on one measure; tourism sites say 2,200 ft (about 670 m) | Depends on how the curved crest is traced. A straight line across the horseshoe is shorter than the curved edge. |
| American Falls | 320 m (1,050 ft) in Wikipedia; another source gives 830 ft straight and 949 ft zig-zag | Straight-line versus following the ragged crest. |
If you need one figure, say "about 790 m (2,592 ft) measured along the crest" for the Horseshoe and give the 2,200 ft tourism figure as an alternative. Do not present either as exact.
How much water goes over the falls?
| Item | Value | Source note |
|---|---|---|
| Length of the Niagara River | 58 km (36 mi) | Wikipedia |
| Total drop, Lake Erie to Lake Ontario | 99 m (325 ft) | Lake Erie 173.43 m, Lake Ontario 74.1 m; a 326 ft figure circulates but is not confirmed |
| Average flow at the river mouth | About 5,800 m³/s | Wikipedia. This is the whole river, not just the water over the falls. |
| Average flow over the falls | 2,400 m³/s (85,000 cfs) | Wikipedia |
| Share over the Horseshoe | about 90% | Wikipedia |
The average flow over the falls is about 2,400 m³/s (85,000 cubic feet per second), and the recorded peak is 6,370 m³/s (225,000 cfs). The Wikipedia summary we used says about 90% goes over the Horseshoe Falls. The Niagara River as a whole carries more at its mouth (about 5,800 m³/s). The sources we read give both numbers without explaining the gap. Our inference, not a sourced statement, is that water diverted around the falls for power returns to the river below them.
You will also see "168,000 cubic metres per minute". That is a peak daytime figure, and we could not trace it to a primary source. Converted, it is about 2,800 m³/s, which is close to the treaty daytime minimum of 2,832 m³/s below. So it describes ordinary tourist-hours flow and not a record. It is not an annual average either. Do not compare it with the 6,370 m³/s record without converting the units.
The 1950 treaty and the flow schedule
The United States and Canada signed the Niagara Treaty on 27 February 1950. It requires a minimum flow over the falls, higher in the daytime tourist hours. The treaty text, the International Joint Commission and the Canadian treaty database agree on these numbers.
| Period | Hours (Eastern Standard Time) | Minimum flow over the falls |
|---|---|---|
| 1 April to 15 September | 8 am to 10 pm | 100,000 cubic feet per second (2,832 m³/s) |
| 16 September to 31 October | 8 am to 8 pm | 100,000 cfs (2,832 m³/s) |
| All other times | All other hours, including 1 November to 31 March | 50,000 cfs (1,416 m³/s); more if needed to flush ice |
The hours are stated in Eastern Standard Time. In months when clocks show daylight time, a window of 8 am to 10 pm EST would read 9 am to 11 pm on the clock. That conversion is our inference from the treaty wording, so confirm it with the IJC before relying on it. Many summaries simplify this to "100,000 cfs from April to October". That is wrong in the evenings after 15 September, when the daytime window ends at 8 pm EST, and after 31 October, when the minimum drops to 50,000 cfs around the clock. The 50,000 cfs figure is a minimum and may be raised to flush ice.
The treaty sets a floor, not a measured flow, so it tells you nothing about how much water you will see on a given day. Diversion for power is the background to the treaty. Canada's share includes about 5,000 cfs of Long Lac-Ogoki diversion water, per the IJC. A 1909 Boundary Waters Treaty capped diversions earlier, with a figure of about 56,000 cfs for both countries combined appearing in Wikipedia only, so we treat it as low confidence.
Power plants and control structures
Part of the water in the Niagara River is diverted to power stations, and the treaty decides how much must stay in the river to go over the falls. The main structures are below.
| Structure | What the sources say | Conflicts and caveats |
|---|---|---|
| International Control Dam | Completed 1954; Chippawa-Grass Island pool; operated by Ontario Power Generation; monitored by the International Niagara Board of Control | Wikipedia summary; the treaty requires an unbroken curtain of water over the crest |
| Sir Adam Beck I | First power 1922 | Some sources say 1921 |
| Sir Adam Beck II | 1954 | Pump generating station of 174 MW; the complex is listed at 1,962 MW nameplate (Wikipedia citing OPG) |
| Niagara Tunnel | In service 21 March 2013; about 150 MW more | OPG page was not reachable; Wikipedia summary |
| Robert Moses Niagara Power Plant | Lewiston, NY; opened 1961; 13 generators; 2,525 MW installed | One older listing says 2,675 MW; NYPA page not reachable |
| Lewiston Pump-Generating Plant | 240 MW, next to the Moses plant | Wikipedia summary |
| First hydropower | 1881 direct-current station; alternating-current system on 26 August 1895 | Wikipedia |
Wikipedia is our source for capacities, because the OPG and NYPA pages did not load. Where two figures exist (Beck I in 1921 or 1922, Moses at 2,525 or 2,675 MW), we show both and do not choose. The park attractions that let you see the old power stations are covered separately; see things to do near Niagara Falls.
The ice boom and winter
The Lake Erie-Niagara River Ice Boom is a floating barrier across the outlet of Lake Erie. The International Joint Commission says it has been installed each winter since 1964. It has 22 pontoon spans across about 2.7 km (1.7 mi), with steel pontoons since 1997-98. The cost is shared by the New York Power Authority and Ontario Power Generation, and NYPA installs it.
The boom matters for boat tours because ice delays seasons. Niagara City Cruises opened on May 1, 2026 after heavy Lake Erie ice, and Clifton Hill's report said the boom had been removed by then. Maid of the Mist says its spring opening depends on Lake Erie ice. Read more in Niagara Falls in winter.
Geology and erosion
The falls formed at the end of the Wisconsin glaciation. They began near the Niagara Escarpment between Queenston and Lewiston about 10,900 to 12,500 years ago, depending on the source, and have cut back roughly 11 km upstream to their present position. The rock is a hard cap of Silurian Lockport dolostone over softer Rochester shale. Water undercuts the shale, and the cap breaks off in blocks. At the Whirlpool, the river hit an old, sediment-filled valley and carved its sharp bend.
| Measure | Figure | Source note |
|---|---|---|
| Historical average retreat | About 1 to 1.5 m a year (3 to 5 ft a year over the last 500+ years) | Wikipedia and New York State Museum |
| Modern rate | About 0.3 m (1 ft) a year, mainly attributed to water diverted for power | Sources range from 0.3 to 1 m a year |
| Age of the falls | about 10,900 to 12,500 years (sources differ) | Wikipedia gives about 10,900; other sources give 11,000 to 12,500 |
| Length of gorge | about 11 km (about 7 mi); sources give 11 to 11.4 km | Wikipedia and a University at Buffalo field-trip page |
The ranges are real. Historical retreat of 1 to 1.5 m a year is an average over centuries, and the modern rate is lower largely because diversion for power reduces the flow over the crest. Do not read "1 foot a year" as a prediction for any year. Projections that the falls will reach Lake Erie in about 50,000 years (a distance of about 32 km) come from Wikipedia, and we rate them low to medium. We do not publish "the falls will disappear" without that nuance, because the rock near Lake Erie also changes the pace.
Notable events
1969: the American Falls dewatered
In 1969 the US Army Corps of Engineers (Buffalo District) built a cofferdam at the American Falls so the rock could be worked on while dry and stabilised. Work started on 9 June 1969, and the summaries we read cite more than 28,000 tons of rock, with a blast recorded on 25 November 1969. An IJC report in 1975 decided against removing the pile of fallen rock. These details come from History.com and Wikipedia, so they are medium confidence.
Table Rock
Table Rock was a ledge at the edge of the Horseshoe Falls on the Canadian side. Wikipedia and local history sources record a first collapse in 1818 and a large fall in 1850, followed by more falls in 1853, 1876 and 1897. The remaining ledge was blasted in 1935, on 24 June according to a Lewiston history. The month of the 1850 fall is disputed: 26 June in a Niagara Falls Public Library item, and July in Wikipedia.
The 1912 ice bridge
Ice sometimes jams below the falls and forms a bridge people once walked on. Period newspapers and a Brock University exhibit report that the ice bridge broke on Sunday 4 February 1912, and that three people died, a couple and a 17-year-old from Cleveland. The bodies were not found. We did not find the date of the law that later banned ice-bridge walking. A 1931 ice bridge is not verified here. Separately, Wikipedia says an upstream ice jam on 29 March 1848 nearly stopped the flow for up to 40 hours.
What we do not publish
These numbers are popular, but we found no authoritative source for them. We leave them out rather than guess.
- Water temperature. The only data we found was a single citizen-science reading of 15.94 C near Navy Island on 22 October 2024 and an aggregator we do not trust.
- Mist height or volume. No authoritative figure was retrievable.
- Fog frequency on the river or on the boats.
- Which falls the sun lights at what time. We found no source for the compass facing of the falls. Sunrise and sunset times on our pages are computed (see the methodology).
- Monthly visitor counts. Niagara Falls Tourism ranks seasons but publishes no monthly counts.
- Bridal Veil height from an official source.
How to use these numbers
- If you are writing a school project, quote a figure with its basis: "about 57 m, measured to the river".
- If you are comparing the American and Horseshoe Falls, check whether the heights are measured to the rock pile or the river.
- If you are planning a visit around flow, remember that the treaty sets a minimum. It does not report what is flowing today.
- If you see 168,000 m³ per minute, treat it as a daytime figure and convert it before comparing with other flow numbers.
- If a source gives a single exact number for crest width or recession, ask how it was measured.
If you spot a figure that has an official source we missed, please tell us. Our correction process is described in the methodology and every change is logged in the changelog.
Frequently asked questions
How high is the Horseshoe Falls?
About 57 m (187 to 188 ft), according to Wikipedia. We could not reach a Niagara Parks, NY State Parks or USGS page to confirm it, so we treat it as approximate. The popular figure is 188 ft.
How much water goes over Niagara Falls?
On average about 2,400 m³/s (85,000 cfs) goes over the falls, with a recorded peak of 6,370 m³/s (225,000 cfs). About 90% goes over the Horseshoe Falls. These are Wikipedia figures; the treaty sets a floor, not a daily measurement.
What does the 1950 treaty require?
A minimum of 100,000 cfs (2,832 m³/s) over the falls from 1 April to 15 September, 8 am to 10 pm Eastern Standard Time, and from 16 September to 31 October, 8 am to 8 pm. At all other times the minimum is 50,000 cfs (1,416 m³/s), and may be raised to flush ice.
How fast is the falls eroding?
Historically about 1 to 1.5 m a year. The modern rate is about 0.3 m (1 ft) a year, mainly because water is diverted for power. Sources range from 0.3 to 1 m a year, so treat any single figure as a range.
How old are Niagara Falls?
About 10,900 to 12,500 years, depending on the source. Wikipedia gives about 10,900; other sources give 11,000 to 12,500. The falls began near Queenston and Lewiston and have cut about 11 km upstream.
Did the American Falls ever stop flowing?
In 1969 the US Army Corps of Engineers built a cofferdam and dewatered the American Falls for rock inspection and stabilisation. Work began on 9 June 1969. In 1848 an ice jam upstream nearly stopped the flow for up to 40 hours, per Wikipedia.
Sources and further reading
- 1950 Niagara Treaty (text)
- International Joint Commission: Niagara FAQ
- Canada treaty database: 1950 Niagara Treaty
- International Joint Commission: Lake Erie-Niagara River Ice Boom
- Niagara Falls (Wikipedia)
- Niagara River (Wikipedia)
- International Control Dam (Wikipedia)
- Sir Adam Beck Hydroelectric Generating Stations (Wikipedia)
- Robert Moses Niagara Power Plant (Wikipedia)
- Table Rock, Niagara Falls (Wikipedia)
- New York State Museum: Niagara Falls geology
- History.com: the 1969 dewatering of the American Falls
- Brock University Library exhibit: the ice bridge
- Maid of the Mist: FAQ
Facts were last checked against these sources on October 17, 2026. Operator schedules, prices and conditions change; confirm with the operator before you travel.